
Turn data into revenue
Your Data is Useful. Grow with your Data!
Want to get accurate big data visualization without IT involvement, without a visualization specialist? You will gain quick insights and make fast decisions without wasting time on manual analysis.
Clearly communicate complex data, including big data
Uncover patterns in your data
Pinpoint what action needs to be taken
Make informed decisions based on facts
Combine data sets and automate manual processes
Enable data discovery and self-service
Improve data quality and accuracy
Enable faster and smarter decision making
Do you need Data Analytics and Visualization Services?
Our expertise is to create an Intuitive Data Analysis & Dashboard Visualization Model with a User-Friendly Interface to translate your Data into Insights and make it easy to understand your business.
Data Analysis: Data analytics is the collection, transformation, and organization of data in order to draw conclusions, make predictions, and drive informed decision making.
Data Insights: Data insights refers to the deep understanding an individual or organization gains from analyzing information on a particular issue. This deep understanding helps organizations make better decisions than by relying on gut instinct
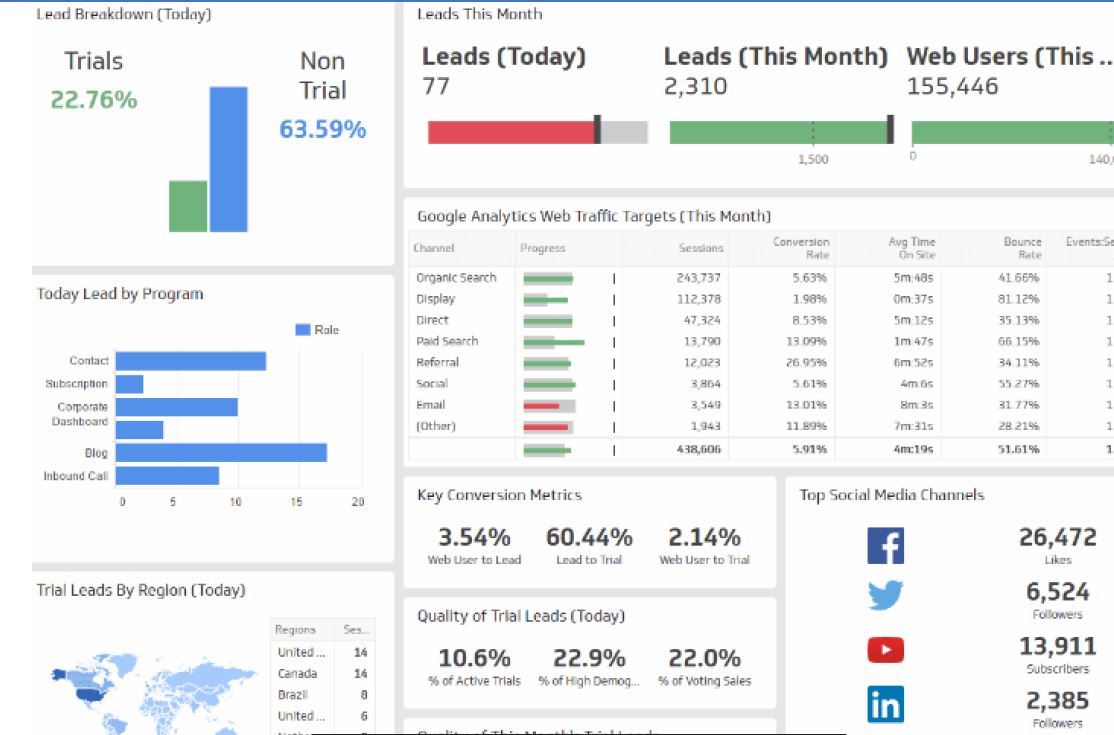
Dynamic Reports: Dynamic dashboards are google data studio's most powerful feature. You can use google data studio to combine multiple datasets and visualize them all on the same dashboard, or you can create a custom report with only one dataset in it.
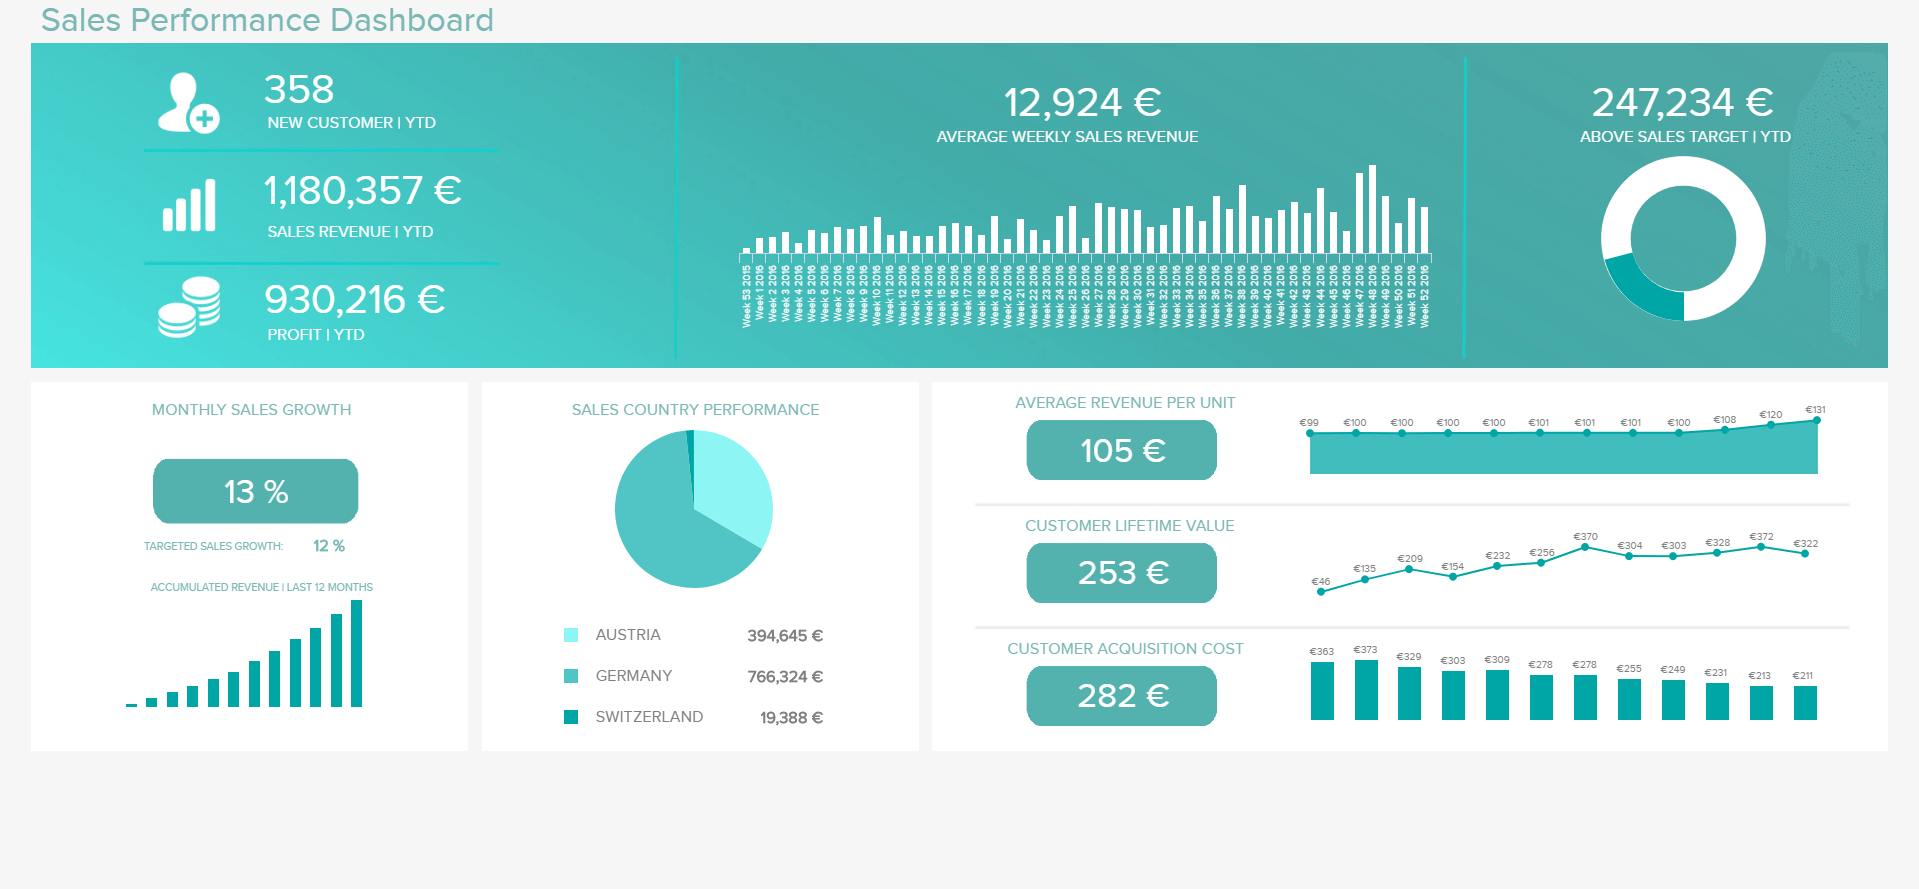
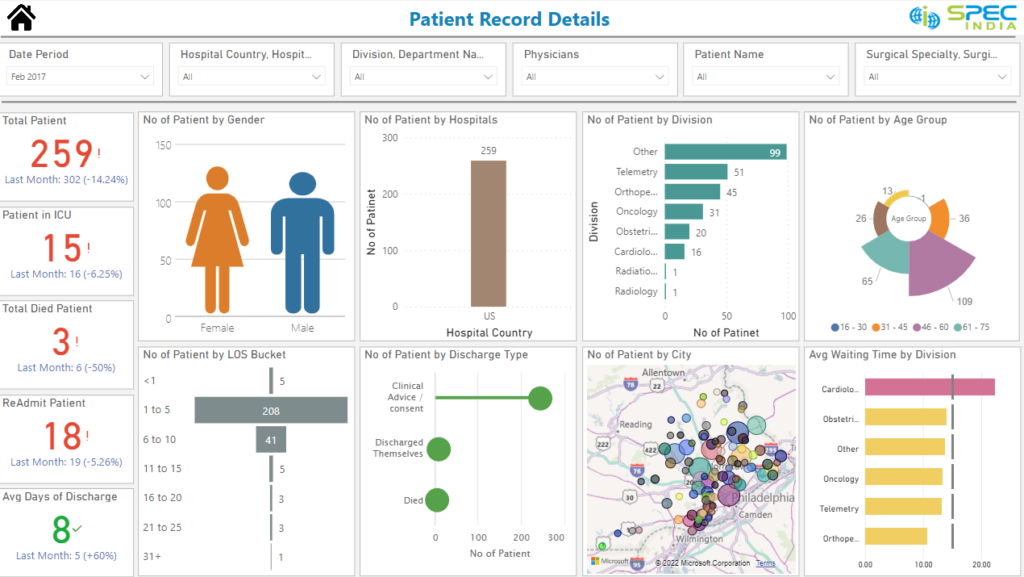
Interactive Dashboard: An interactive dashboard is a data visualization tool that allows business teams to track, analyze, and display metrics of various sorts. Dashboards feature charts, tables, maps, and other visualizations to help viewers understand the story the data tells.
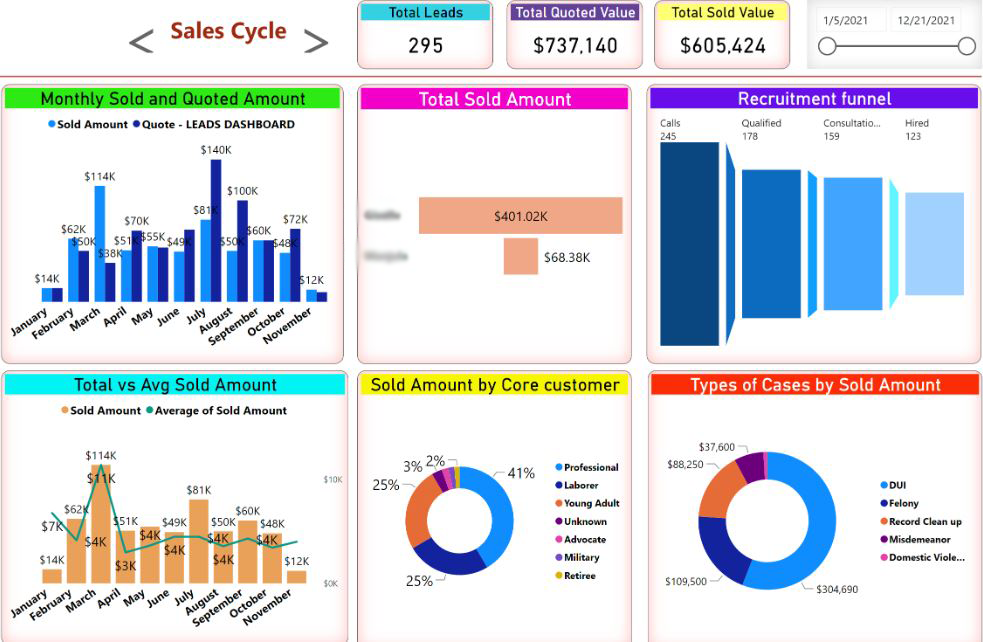
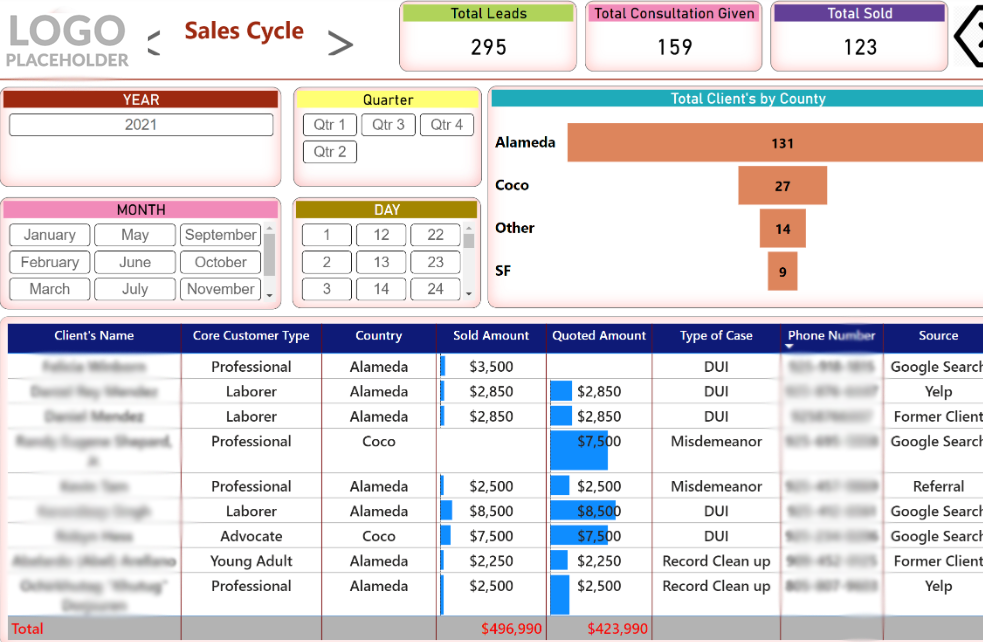
Use Cases
For the productive work of a company, it is important to know the overall picture of production, finances, and much more. That’s why FlairDev offers to collect the information in a single piece, visualize each point, and then highlight strengths or weaknesses of a business.
Get in touch
Get the latest articles from our press, discuss & share